ChiVaxBot
Which Chicagoans are getting vaccinated? A viral Twitter bot for South Side Weekly

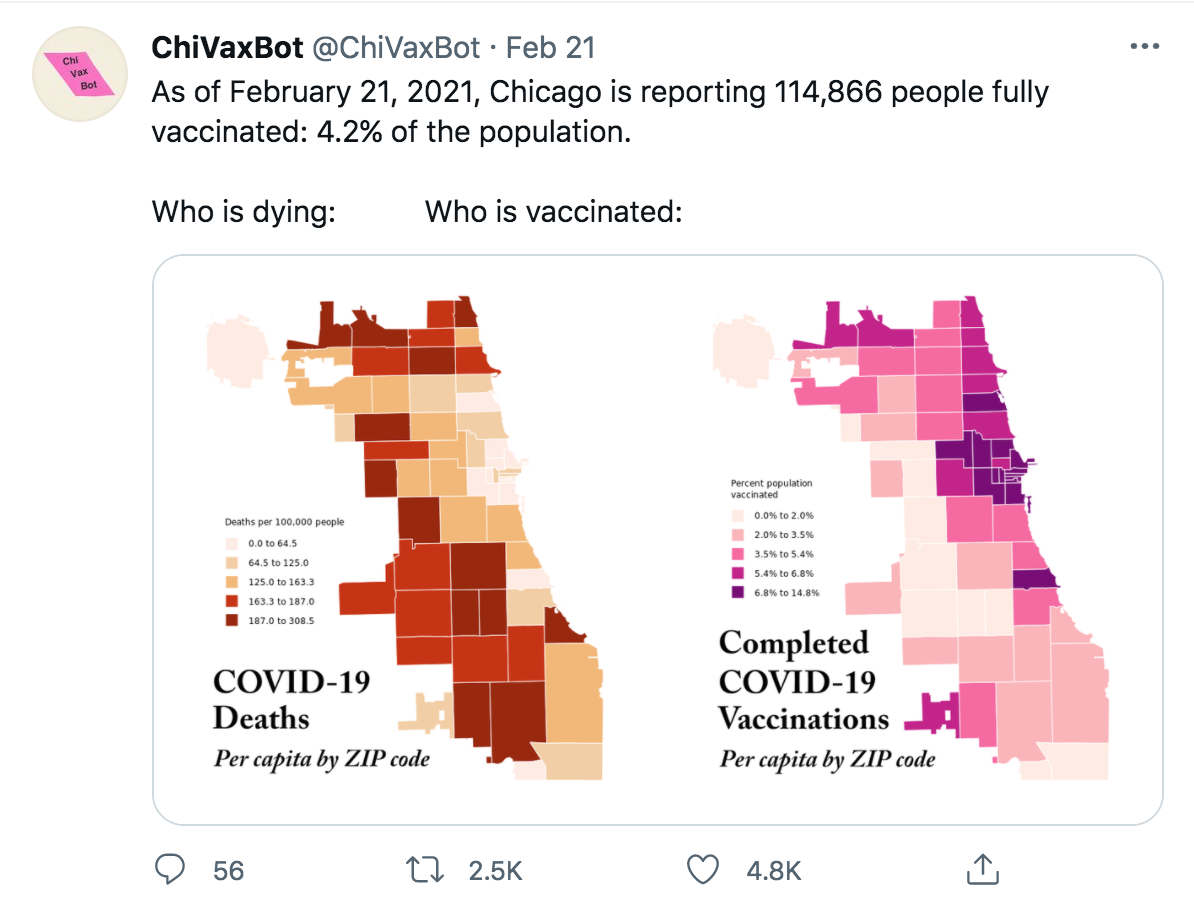
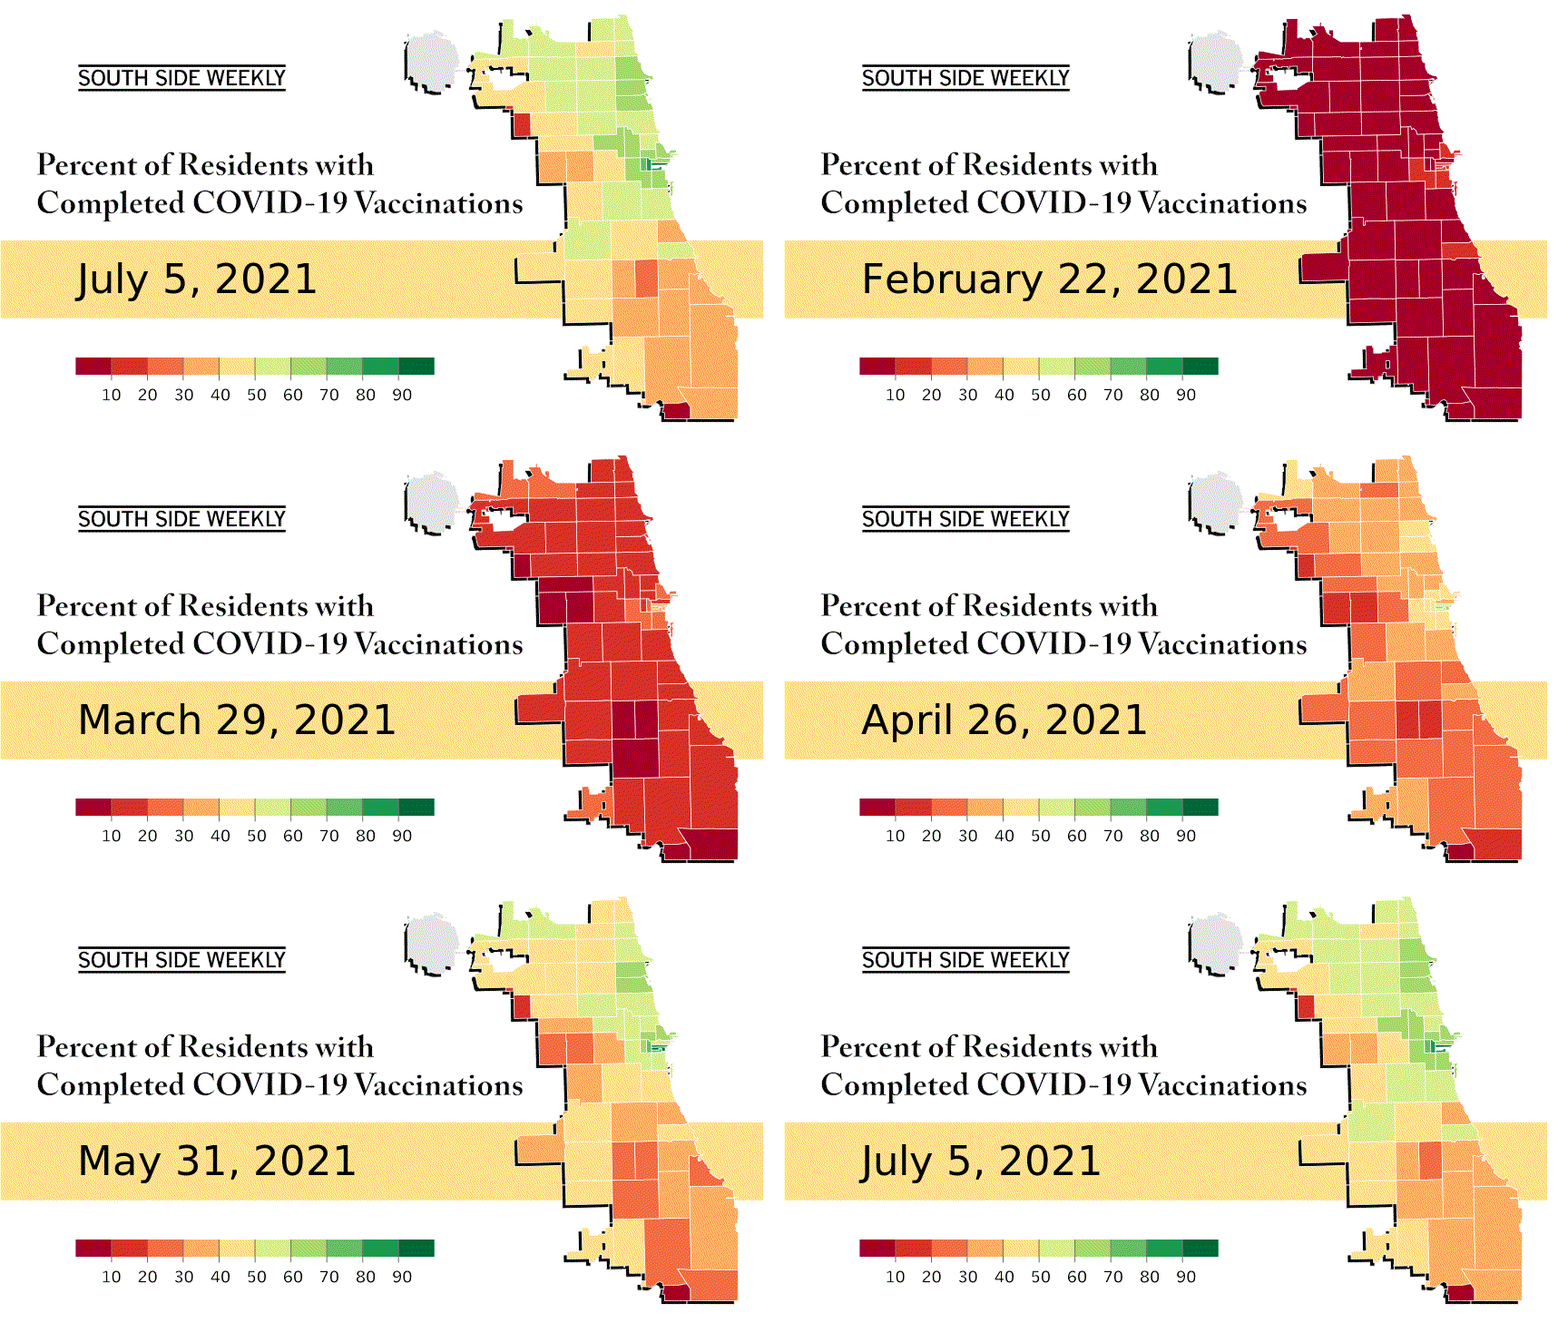
Every day @ChiVaxBot pulls in new data from the city of Chicago and generates two maps: one showing Covid-19 deaths in Chicago, and the other showing vaccinations.

I developed this with Charmaine Runes for South Side Weekly as a way to track vaccine access and disparity on a hyperlocal, daily scale. We wrote up an explanation of this work here.

This was an experiment in SVG generation for me, and I’m quite pleased with the string manipulation method we landed on for generating lightweight images and a gif. The code for this project is open source here.